
Improving access to redress for workers vulnerable to violence and harassment in South Asia
Experts discuss the factors that make some workers more vulnerable than others to violence and harassment.
This page is approximately a 5 minute read
This page was published on
The 2021 World Risk Poll reveals that many countries and regions with high disaster experience are also those with low resilience, highlighting areas of vulnerability among communities where action is needed to make people safer.
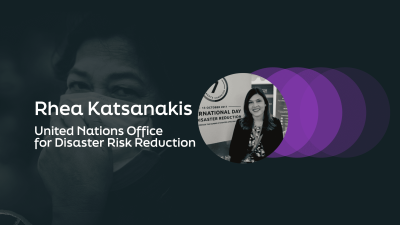
In this blog, Rhea Katsanakis, Project Lead at the United Nations Office for Disaster Risk Reduction (UNDRR), discusses how disaster experience correlates with resilience, and why organisations need to design systems to help communities better understand how they can reduce their risk and build resilience.
The UN Global Assessment Report 2022 (GAR 2022) found that to increase long term resilience and trigger a cultural and behavioural shift towards reducing risk and building resilience, it is crucial to design systems that factor in how human minds make decisions about risk, as cognitive biases and social motives shape the perception of risk and related decisions significantly. Decision-making in the face of risk and prevention and preparedness seems to also be influenced by direct disaster experiences.
As the GAR 2022 points out, the response to Covid-19 illustrated positive and negative extremes in how people make decisions about risk, and what prompts governments and individuals to act. At the individual level, for example, public compliance with mask-wearing and social distancing were initially a challenge in Italy, but personal experiences soon led to a perception that Covid-19 was a serious and relevant threat. Residents became more active in undertaking preventive actions compared with their European neighbours, who had not yet experienced these impacts, and increased their resilience. Compliance with mask-wearing orders or other Covid-19 mitigation measures in the United Kingdom and the United States, on the other hand, quickly became polarized. For many, it was less a question of rational risk reduction than a public display of political identities. The result was riskier behaviour and lower compliance with mitigation measures.
At a government level, it can be observed that countries with a prior experience of the severe acute respiratory syndrome SARS, including China, the Republic of Korea and Thailand, responded more quickly and effectively than other countries to contain the spread of Covid-19. Their populations were sensitized to the threat of pandemics due to prior experience, and they had already reconfigured institutions that were better able to work across silos to address the pandemic spread. This reconfiguration of institutions is echoed in the call of GAR 2022 for countries to reconfigure governance and financial systems to work across silos and to design policies in consultation with the affected people, which has proven to be more effective when managing systemic risk in the face of uncertainty.
The planning systems and institutional culture of the twentieth century worked towards fixed time frames, for known outcomes in contexts that were largely stable and linear or were assumed to be. The complexity of today’s world and the destabilization of global ecosystems through climate change and other direct human impacts require that twenty-first century institutional cultures become more agile and flexible, which includes working across disciplines and institutional silos, and creating a commonly understood ‘risk language’ and terminology. Building on the experiences from China, the Republic of Korea and Thailand at the global level, the WHO launched a global hub for pandemic and epidemic intelligence in an effort to extend the reach of “collaborative intelligence” in future pandemic response.
Both individual and institutional decision-making processes on the other hand fail to consider the costs of disasters and the benefits of risk reduction, particularly in the case of novel, rare or compound risk or events, where individuals have limited or no personal experience, as is the case for systemic risk or extreme events. One example is the behaviour towards the increasing risk and impacts of the climate emergency. For example, in the United States, there is evidence that it took a recent spate of wildfires, tornadoes, record heatwaves and hurricanes, for over 75% of the public to feel that climate change is happening.
But disaster experiences can also be cancelled out by other forces that drive human behaviour as another example from GAR 2022 shows. A recent study of a wildfire-prone community in the city of Valparaíso, Chile, found that psychological factors like a perceived lack of control over their lives and the environment crucially influenced people’s risk management behaviour. It hindered preventive actions and made risk reduction a secondary issue for many. Even if people were aware of the risk and experienced fires several times per year, few actions resulted from the risk awareness. Pointing to positive and practical actions that individuals can take to support themselves is often a more effective approach.
In conclusion, the understanding of cognitive science and how it influences risk behaviour is important to increasing the chances of risk management action leading to sustainable long-term change that builds resilience.
One way to make positive use of the, often traumatic, experience of a disaster is also mentioned in GAR 2022. In the immediate aftermath of a crisis, engaging survivors in risk dialogues might seem insensitive. However, by using empathy and building trust, communication practitioners can compile compelling stories of lived experiences that may inform and motivate subsequent risk communication. It can also preserve memories that counter amnesia bias when disaster events of the past are forgotten.
Experts discuss the factors that make some workers more vulnerable than others to violence and harassment.
Dr. Joel Gill and Dr. Faith Taylor discuss how World Risk Poll data will be used to understand contributing factors to existing high levels of household preparedness in the face of natural hazards.
The Disaster Risk Reduction for Africa (DRR4Africa) project seeks to improve the resilience of three selected African cities to climate-induced disasters by collaboratively identifying the biggest disaster threats, and developing solutions packages tailored to these cities.

